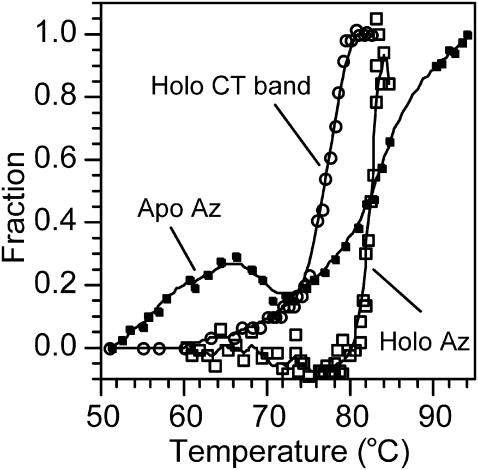
FIGURE 5.
Thermal denaturation curves for holo azurin monitored by fluorescence at 348 nm (Holo Az) and by the absorption band at 625 nm (Holo CT band) and for apo azurin. The temperature was increased at a rate of 0.5°C/min. The denaturation temperature measured for holo azurin monitoring fluorescence from Trp is larger than that obtained measuring the decrease in the CT band at 628 nm, indicating that each technique probes different local conformational changes. The apo azurin denaturation curve presents a hump in the 50–70°C temperature interval and the slope where the unfolding occurs is more abrupt than for holo azurin.

