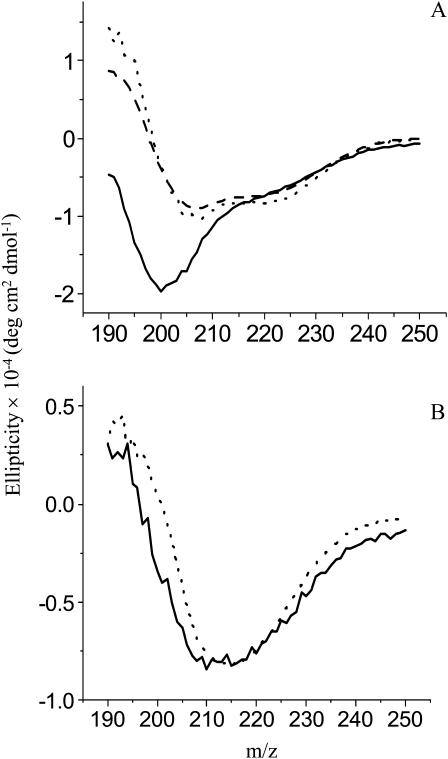
FIGURE 4.
CD spectra of PFA-SC3 upon binding to a Teflon surface. (A) CD spectra of PFA-SC3 in solution (solid line) and after binding to colloidal Teflon (dotted line), SC3 bound to colloidal Teflon serving as a control (dashed line). (B) CD spectra of Teflon-bound PFA-SC3 (solid line) and SC3 (dashed line) heated at 65°C in the presence of 0.1% Tween 80.

