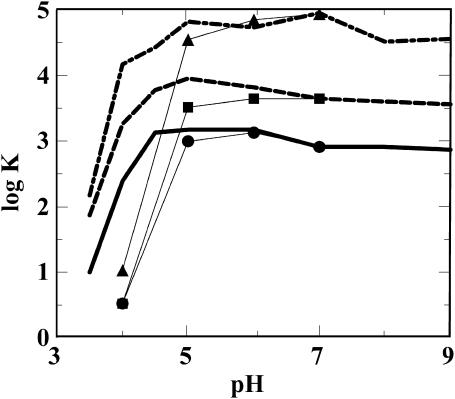
FIGURE 6.
Influence of peptide charge on CaM binding at different pH values. Simulated curves representing the behavior of different peptides K4QK7QR17Q (solid line and filled circles), K7G (dashed line and filled squares) and smMLCK-am-ac (dot-dashed line and solid triangles). For each peptide, the log K shift (Δlog K) is calculated relative pH 7; Cs = 1.1 and Cp = 0.1 mM. Fat curves without symbols are obtained with a titratable protein, whereas curves with symbols are obtained with a fixed charge distribution on all amino acid residues. Note that the absolute value of log K has no meaning; only differences between the simulated numbers are of interest.

