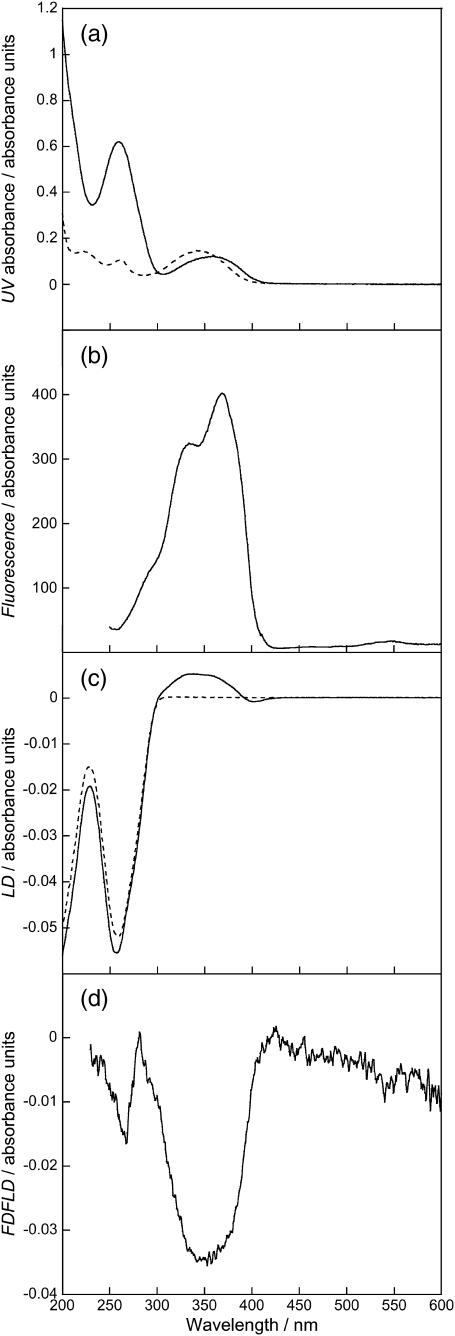
FIGURE 8.
Spectra of DNA (1000 μM) and DAPI (50 μM). (a) Absorption spectra of DAPI (dashed line) and DAPI-ct-DNA (solid line), (b) fluorescence excitation spectrum of DAPI-ct-DNA with all emitted photons detected, (c) LD spectra of ct-DNA (dashed line) and DAPI-ct-DNA (solid line), and (d) FDFLD spectrum of DAPI-ct-DNA. All solutions prepared using a sodium cacodylate buffer (10 mM, pH 7).

