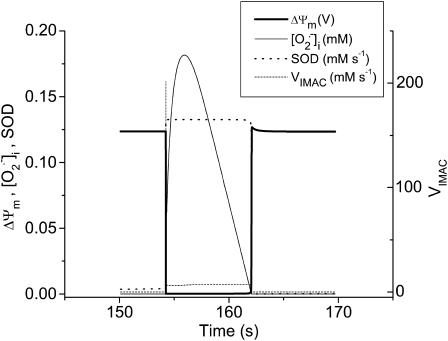
FIGURE 6.
Sequence of events occurring during an oscillatory cycle. The time course of changes in ΔΨm, IMAC flux, SOD activity, and cytosolic  during a single cycle of the mitochondrial oscillator. At a critical level of mitochondrial ROS accumulation (see Fig. 4 E) the IMAC channel rapidly opens, denoted by the spike in outward current, provoking the sudden release of
  from the mitochondria into the intermembrane space. The current through IMAC quickly declines due to the loss of ΔΨm (which decreases the driving force for anions; see Eq. A13). The rate of SOD increases in parallel with the burst of available
  and stays high until the
  is consumed, at which point IMAC closes, allowing ΔΨm to repolarize, initiating the next cycle.

