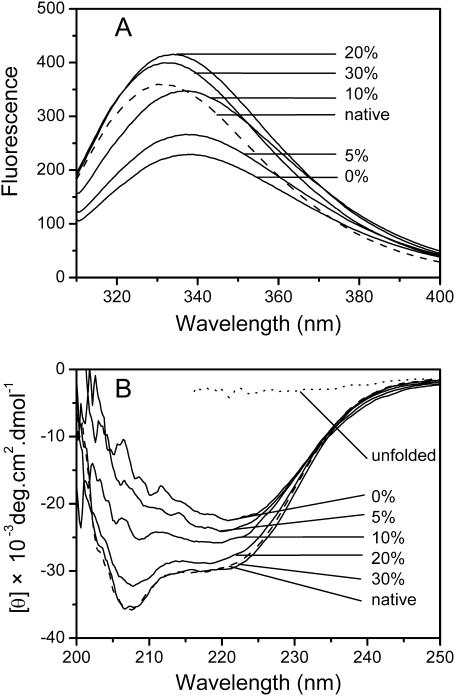
FIGURE 3.
The intrinsic fluorescence spectra (A) and circular dichroism spectra (B) of CK after 30 min incubation at 50°C in the presence of glycerol. The fluorescence and CD spectra of native CK in 20 mM Tris-HCl buffer (dashed lines) were measured at 25°C. The CD spectrum of unfolded CK was measured using a sample completely unfolded by 4 M guanidine hydrochloride.

