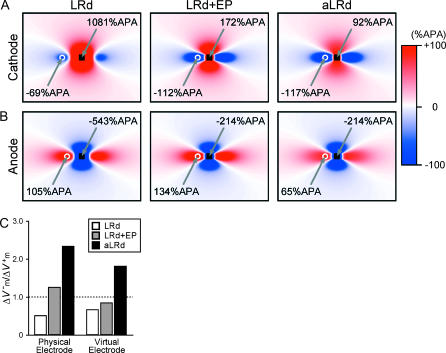
FIGURE 6.
ΔVm maps after 10-ms cathodal (A) and anodal (B) shocks of strength 20 mA in the LRd, LRd+EP, and aLRd sheets. Each ΔVm map is normalized to APA. Only part of the sheet, the one outlined by the black dotted rectangle in Fig. 1 B, is shown. The black square represents the unipolar shock electrode. The white circle denotes the site of peak ΔVm magnitude in the virtual electrode. (C) Asymmetry ratios in the three cases at the centers of the black squares (physical electrodes) and the white circles (virtual electrodes) in panels A and B.

