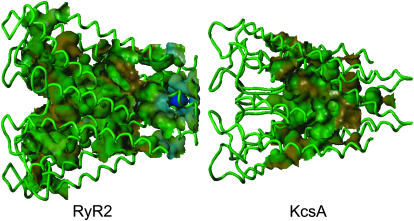
FIGURE 6.
The hydrophobicity projected onto the water accessible surface of the RyR2 model compared to KcsA. Hydrophobicity of the pore-lining residues is symbolized as colors: (brown) the most hydrophobic, (green) borderline hydrophobic, and (blue) the most polar. Both structures are orientated such that the cytosolic side is on the right.

