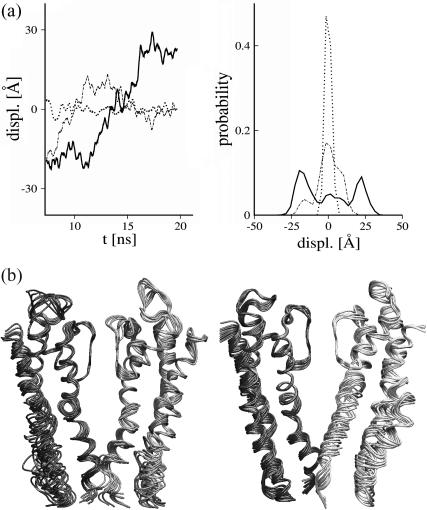
FIGURE 12.
Collective motions of the tetramer for the activating-field trajectory. (a) Motion along selected essential modes determined from the covariance analysis. (Left) displacements calculated from the projection of internal movements along the 1th, 2nd, and 15th modes (eigenvector). (Right) Corresponding probability distributions of the displacement along the modes. (b) Superposition of frames (time windows of 2 ns) obtained from the projection of the motion onto the first essential mode. For clarity, only S4 and pore domain segments are shown for subunits kch1 and kch3 (left) and kch2 and kch4 (right). The amplitudes of the motion are rescaled by a factor of 0.2.

