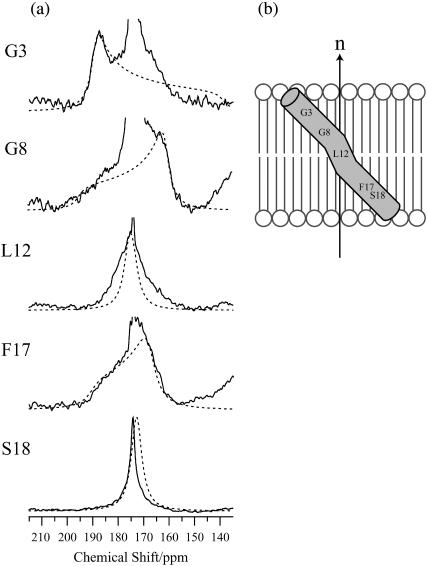
FIGURE 9.
(a) 13C NMR spectra showing the carbonyl regions for a variety of 13C-labeled pin2 bound to lipid bilayers (P/L = 1/20) under slow MAS conditions (solid line, same as Fig. 5), with the best-fit simulated spectra (dotted line) superimposed. (b) Proposed model for orientation of pin2 in lipid bilayers.

