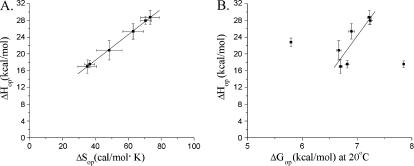
FIGURE 8.
(A) Correlation between enthalpy and entropy changes for opening of the central basepairs in the DNA dodecamer. The slope of the fitted line corresponds to a compensation temperature Tc = (306 ± 4) K. (B) Correlation between opening free energy changes at Thm (20°C) and opening enthalpy changes. The fitted line corresponds to the equation ΔHop= −(100 ± 34) + (18 ± 5) × ΔGop with a correlation coefficient of 0.87.

