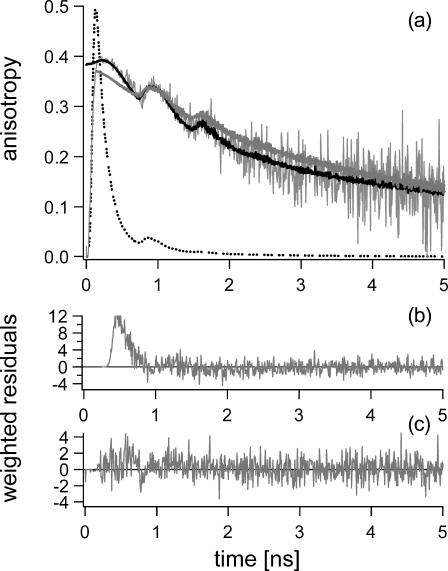
FIGURE 2.
(a) Experimental fluorescence anisotropy decay (noisy gray line) of wild-type GR at 293 K (50 mM potassium phosphate buffer pH 7.6, data acquired at 7.0 ps/channel), and corresponding theoretical data as obtained from the nonassociative fitting with five lifetime components and two rotational correlation times (solid gray line), and from the associative fitting with five lifetime components and a model for anisotropy decay as described in Table 1 (solid black line). The total fluorescence decay normalized to 0.5 (dotted line) has been presented for clarity. Note the difference in the quality of both fits in the first 600 ps of the anisotropy decay as illustrated by the weighted residuals presented for nonassociative (b) and associative fitting (c). The excitation wavelength was 450 nm and the emission was detected at 557.9 nm.

