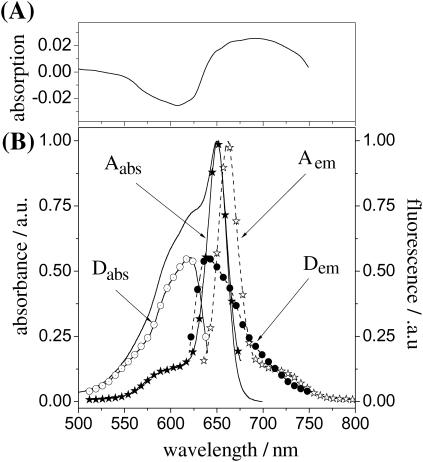
FIGURE 2.
(A) Transient absorption spectrum of APC in PBS as reproduced from Su-Ping et al., 2001. (B) Steady-state absorption (solid line) and fluorescence (dashed line with stars, excitation at 632 nm) spectra of APC in a PBS buffer, pH 7.4. Shown in the same panel are the calculated individual absorption (solid line with open circles for α84 and solid line with stars for β84) and fluorescence spectra (dashed line with solid circles for α84 and dashed line with open stars for β84) of the chromophores in APC (see text for details).

