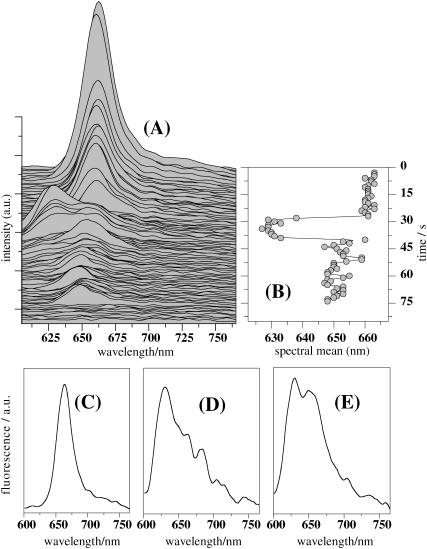
FIGURE 7.
(A) Fluorescence spectral run (1 s integration/spectrum) detected from a single APC trimer on 568-nm CW excitation. (B) Time course of the emission maximum of the spectra from panel A. Single-molecule fluorescence spectra accounting for (C) single β84, (D) single α84, and (E) mixture of single β84 and α84 chromophores.

