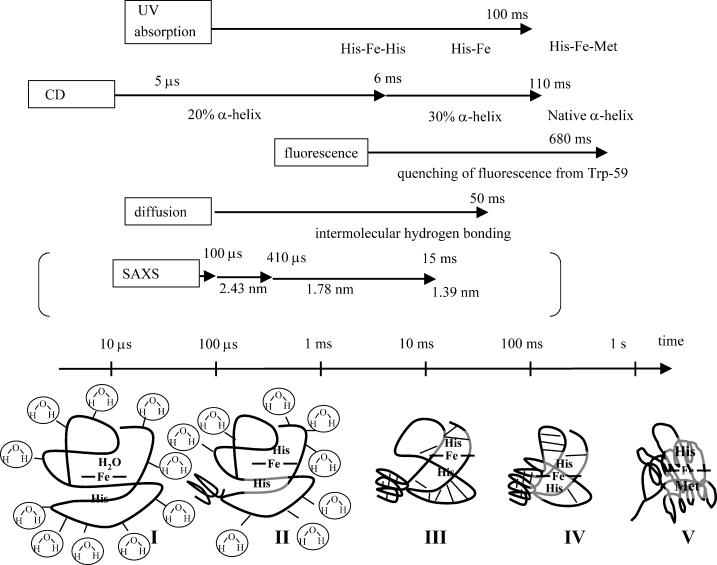
FIGURE 6.
Schematic illustrations of refolding dynamics of Fe(II) Cyt c monitored by various properties. Rough timescales for these dynamics are shown by arrows together with the detection method. The rates of protein collapse measured by the rapid mixing experiment using the pH jump for Fe(III) Cyt c is also shown in parentheses just for comparison. Structures in bottom of the figure indicate: (I) unfolded Fe(II) Cyt c, the dominant part of the hydrogen bonding is the intermolecular one between the protein and solvent molecules; (II) a small amount of α-helix is formed; (III) hydrogen bonding is rearranged from the intermolecular one between the protein and solvent to the intramolecular one; (IV) formation of the α-helix in the major part and the ligand exchange; (V) native Fe(II) Cyt c. The thick lines indicate the protein backbone and the thin lines represent the hydrogen bonding. See text for detail.

