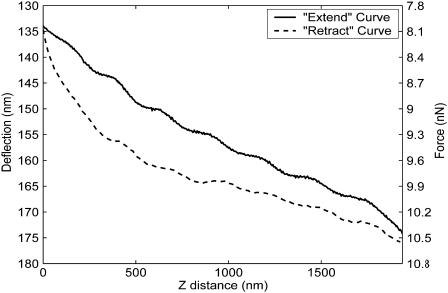
FIGURE 3.
Typical rejected AFM force-distance data. Upon visual inspection, curves that were wavy or that did not appear to have a relatively horizontal noncontact region were discarded. In this and all subsequent force-distance curves, the head of the AFM is approaching the sample (extending) and substrate as the z-distance decreases.

