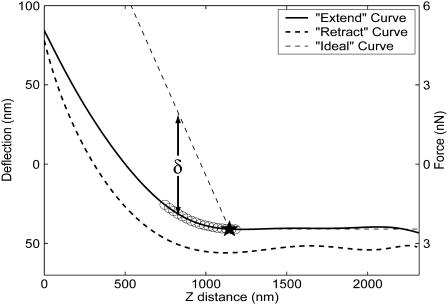
FIGURE 4.
Representative AFM force-distance curve. Some degree of hysteresis is shown between the (solid) extend curve (probe head approaching sample) and the (dotted) retract curve (probe head withdrawing). The ○ indicate the range of data evaluated as candidates for point of initial contact. At each of these candidate points, an ideal curve (dashed lines) is generated, indicating modeled tip deflection on a hard material. The difference between the ideal and extend curves is computed to quantify sample indentation, δ. The slope of the ideal curve has been exaggerated to facilitate visualization of indentation.

