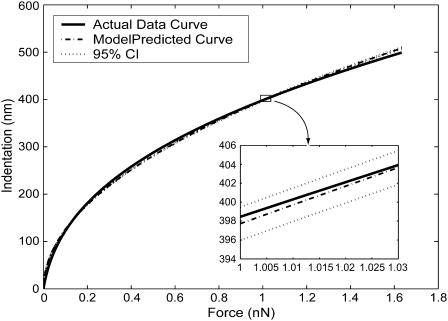
FIGURE 6.
The predicted curve, the 95% confidence interval of the predicted curve, and the best-fit model-predicted curve for the data of Fig. 3. The tightness of the fit along the entire length of the predicted curve is reflected by a relatively low minimum mean-squared error of 50 nm2 (see Fig. 5).

