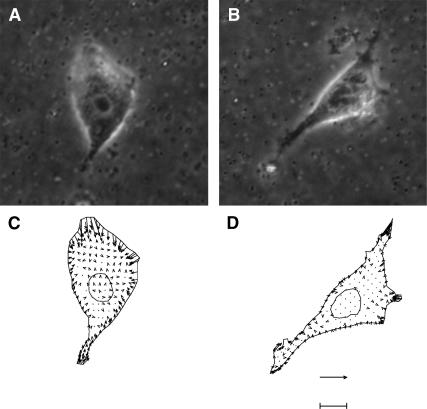
FIGURE 7.
Contractility differences with equal spread area and migration speed. Phase contrast images and corresponding traction fields of a balb/c 3T3 fibroblast adhered to an FN- (A and C) and RGD- modified (B and D) substratum. The bar is 8 μm for the phase contrast images (A and B) and 120 kdyn/cm2 for the most-likely cellular traction fields (C and D). The surface density is ∼2000 μm−2 for FN and ∼200 μm−2 for RGD. These surface densities were chosen because the population average spread area (〈A〉 ∼ 600 μm2) and speed (〈S〉 ∼ 11.1 μm/h) are similar for cells on FN- and RGD-modified substrata, but the population average contractile output is different. Furthermore, the two cells shown were chosen because they represent the closest to the population mean in terms of 〈A〉, 〈|F|〉, and 〈|T|〉. The contractile output of the cell on FN is characterized by |T| ∼ 8.6 kdyn/cm2 and |F| ∼ 0.04 dyn, whereas the cell on RGD is characterized by |T| ∼ 3.8 kdyn/cm2 and |F| ∼ 0.02 dyn.

