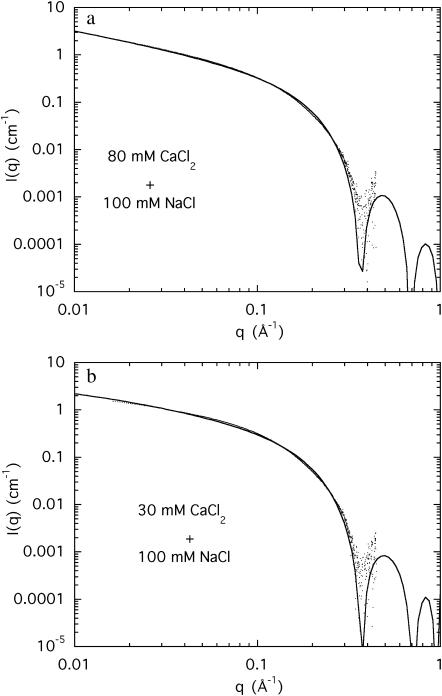
FIGURE 8.
(a) SAXS spectrum from a 3% DNA solution in water containing 100 mM NaCl and 80 mM CaCl2. The fit is Eq. 6, with χ = 5.9 cm−1, r1 = 10.0 Å, r2 = 13.8 Å, h = 0.25, and L = 200 Å; (b) SAXS spectrum from a 3% DNA solution in water containing 100 mM NaCl and 30 mM CaCl2. The parameters to the fit of Eq. 6 are χ = 2.7 cm−1, r1 = 10.0 Å, r2 = 15.5 Å, h = 0.24, and L = 90 Å.

