
FIGURE 10.
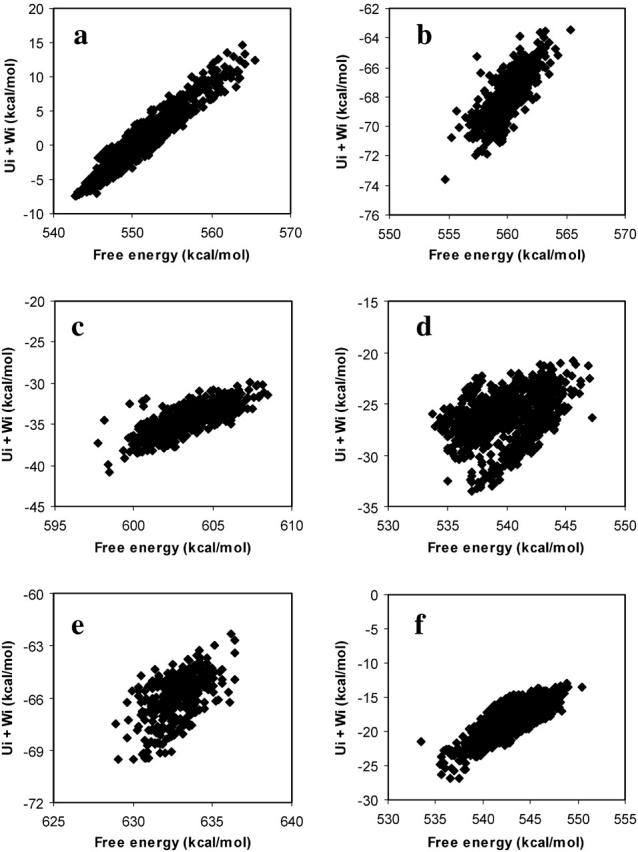
Scatter plots of the free energy μi of conformation i versus the potential plus solvation energy Ui + Wi for (a) benzene with β-CD, (b) naproxen with β-CD, (c) nabumetone with β-CD, (d) nabumetone with α-CD, (e) naproxen with γ-CD, and (f) resorcinol with β-CD.