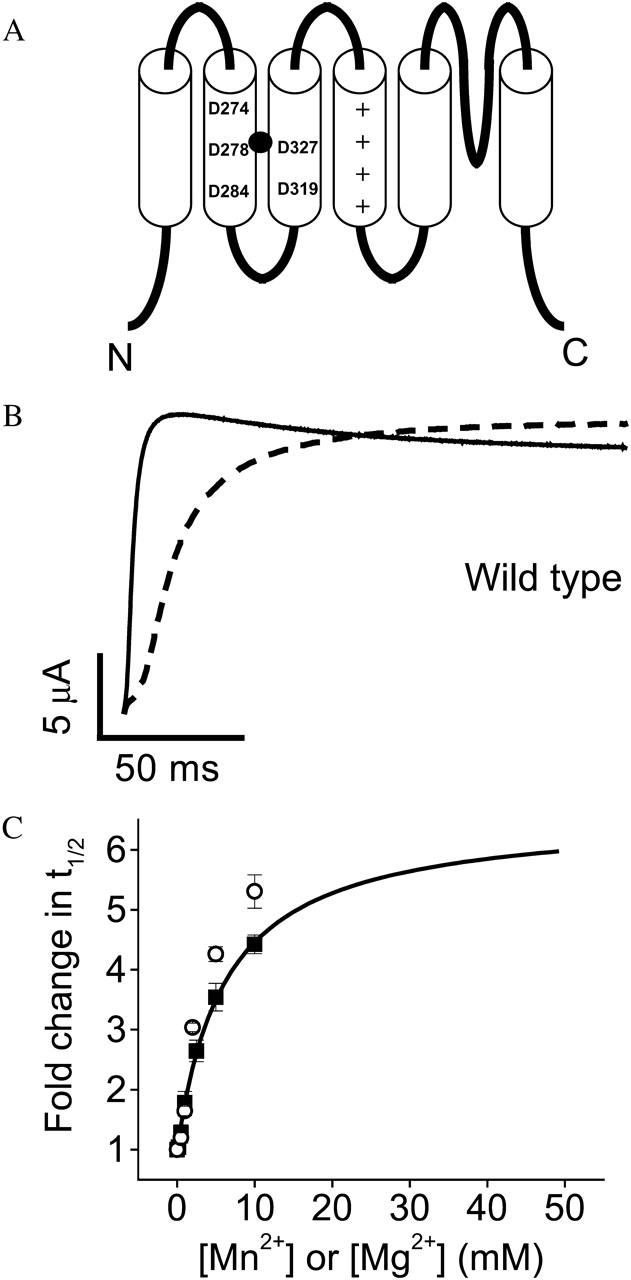
FIGURE 1.

Extracellular Mn2+ slows activation of wild-type eag channels. (A) Cartoon of the membrane topology of the eag protein, including six transmembrane segments, S1–S6, and a re-entrant P-loop that forms the selectivity filter. The approximate positions of eag-specific acidic residues D278 in S2 and D327 in S3 are shown. These residues interact with a bound Mg2+ ion (solid circle) (Silverman et al., 2000). The approximate positions of D274 and D284 in S2 and D319 in S3 are also shown. These acidic residues are conserved throughout the superfamily of voltage-gated K+ channels (Chandy and Gutman, 1995). Symbols (+) denote conserved positively charged residues in S4. (B) From a holding potential of −80 mV, test pulses to +60 mV were applied in the absence (solid trace) or presence (dashed trace) of 10 mM Mn2+. (C) Values of t½ at +60 mV were measured in various concentrations of Mn2+ (▪), or Mg2+ (○), expressed as fold change in t½, and plotted as a function of concentration. Data are shown as mean ± SE, n = 4. The Mn2+ data were fitted with a rectangular hyperbola (solid curve) to estimate the maximal fold-change in t½ and the half-maximal effective concentration (see Table 1). The fitted curve has been extended beyond the data points to illustrate the predicted maximal effect of Mn2+. Mg2+ data are taken from Silverman et al. (2000).
