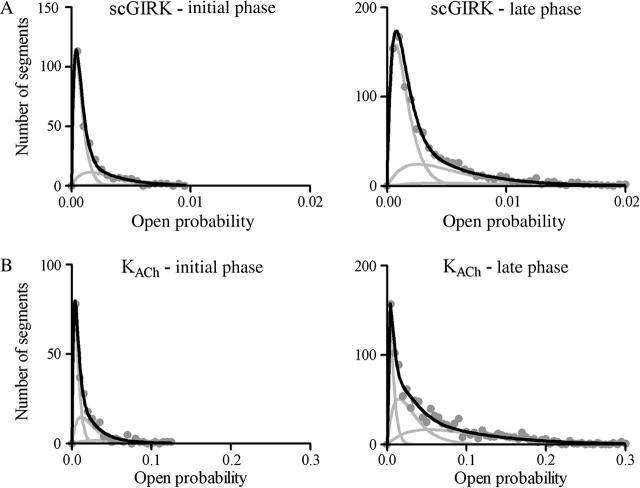
FIGURE 11.
The slow modal transitions in scGIRK and KACh channel gating are associated with changes in the equilibrium among the four functional modes of these channels. (A) Open probability histograms generated from the initial (left panel) and late (right panel) phases of scGIRK activity shown in Fig. 9. The mean po values and the relative areas of different gamma components (shown in parentheses) are po1 = 0.00037 (65.5%), po2 = 0.0015 (28.7%), and po3 = 0.0032 (5.8%) for the initial phase; and po1 = 0.00072 (58.7%), po2 = 0.0026 (32.8%), and po3 = 0.0045 (8.5%) for the late phase of channel activation. The P values computed from these histograms are Pinitial = 0.225, and Plate = 0.270. In this experiment, the changes in the kinetic behavior of the scGIRK were associated with both a slight shift in modal equilibrium and a significant increase in the open probability of different functional modes. (B) Open probability histograms generated from the initial (left panel) and late (right panel) phases of KACh channel activity shown in Fig. 9. The mean po values and the relative areas of different components are po1 = 0.0033 (50.0%), po2 = 0.012 (37.5%), and po3 = 0.031 (12.5%) for the initial phase; and po1 = 0.0033 (20.3%), po2 = 0.015 (37.4%), and po3 = 0.053 (42.3%) for the late phase of channel activation. The P values computed from these histograms are Pinitial = 0.328 and Plate = 0.555 for the KACh channel. Thus, the changes in the gating behavior for this KACh channel were mostly associated with a shift in the modal equilibrium toward gating modes 3 and 4.

