FIGURE 5.
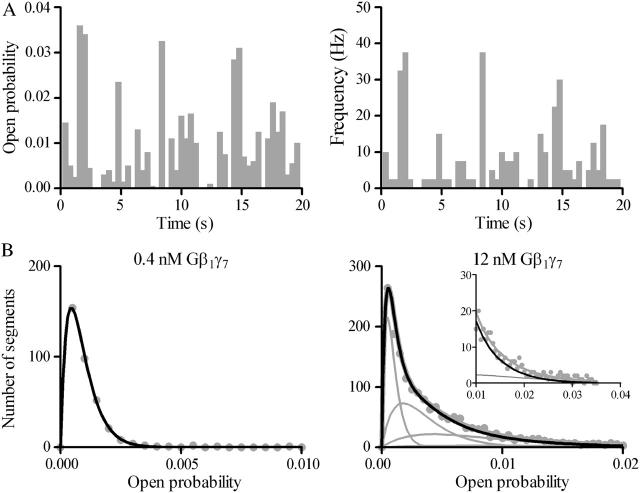
Classification of the scGIRK channel gating. (A) Continuous single-channel recordings were divided into consecutive 400-ms segments and the channel open probability and the frequency of openings were determined for the individual segments. Plots of open probability (left panel) and frequency of gating (right panel) versus time, derived from the initial 20 s of the scGIRK channel recording illustrated in Fig. 2, are shown to illustrate the heterogeneous channel behavior. (B) Modal classification of scGIRK channel gating. Open probability histograms generated from scGIRK channel activity recorded at two different Gβ1γ7 concentrations. The histogram shown at left was generated from pooled data recorded from four different scGIRK channels activated in the presence of 0.4 nM Gβ1γ7. The histogram shown at right was generated from data recordings from a single scGIRK channel activated in the presence of 12 nM Gβ1γ7. The histograms shown in this and the following figures leave out the blank 400-ms data segments and include the active data segments only. The po histograms were fitted by a sum of gamma components  to determine the mean po values and the relative occupancy of different gating components. The mean po values and relative areas (given in parentheses) of different components are po1 = 0.00045 (100%) in the presence of 0.4 nM Gβ1γ7; and po1 = 0.00046 (29.3%), po2 = 0.0018 (37.7%), po3 = 0.0043 (27.2%), and po4 = 0.0085 (5.8%) in the presence of 12 nM Gβ1γ7. The inset shows the right part of the histogram on a different scale to illustrate the minor contribution of the component representing mode 4 (gray line) to the total fit of the histogram. This component was frequently too small to be accurately distinguished from the component representing mode 3, and therefore, modes 3 and 4 were analyzed together in the po histograms.

