
FIGURE 8.
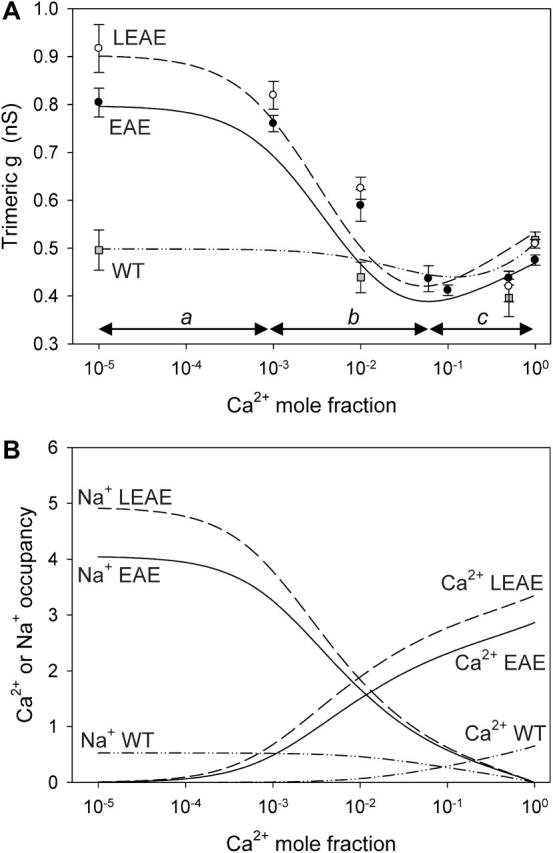
(A) Trimeric conductance (g) of WT and (L)EAE in mixtures of NaCl and CaCl2, pH 7.4 (with Na+ + Ca2+ kept constant at 0.1 M), as a function of the mole fraction of Ca2+ (symbols). Each data point is based on at least five independent measurements. Curves represent simulated DFT-PNP data. The data points plotted over the left end of the abscissa were obtained with solutions that contained no added Ca2+. The Cl− content of the solutions experimentally tested increased from left to right from (in mM) 74.1 (Ca2+ MF = 0) to 145.3 (Ca2+ MF = 1). (B) Number of Ca2+ and Na+ ions that on average occupy the pore of a single monomer in relation to the Ca2+ mole fraction.