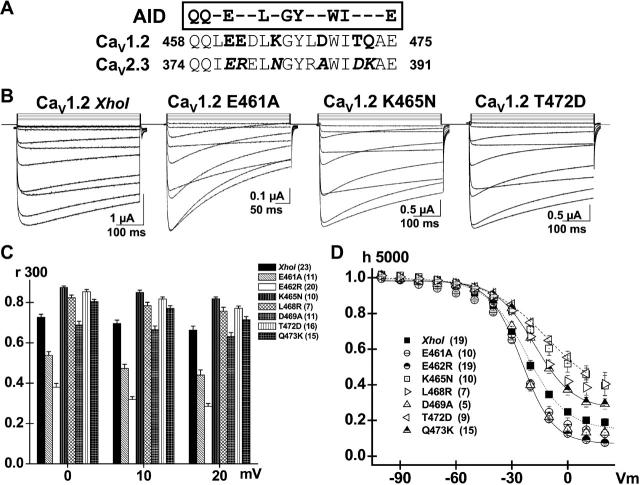
FIGURE 2.
E461A accelerates VDI kinetics in CaV1.2. (A) CaVβ subunit binding site on the α1 subunit (AID) is located within 22 residues of the IS6 transmembrane segment. The primary sequence for the AID helix in CaV2.3 and CaV1.2 channels is shown with the residues putatively accessible for protein interaction highlighted in bold letters. The residues specific to CaV2.3 are shown in italic. (B) Whole-cell current traces are shown from left to right for CaV1.2 (XhoI) wt, E461A, K465N, and T472D in 10 mM Ba2+. Unless specified otherwise, mutants were expressed in Xenopus oocytes in the presence of CaVα2bδ and CaVβ3 subunits, and currents were recorded using the two-electrode voltage-clamp technique in the presence of 10 mM Ba2+. Holding potential was −80 mV throughout. Oocytes were pulsed from −40 mV to +60 mV using 10 mV steps for 450 ms. Capacitive transients were erased for the first millisecond after the voltage step. All mutants tested expressed significant whole-cell currents with similar activation properties (Table 1). (C) r300 values (the fraction of whole-cell currents remaining at the end of a 300 ms pulse) are shown as mean ± SE for the mutated hydrophilic residues from 0 to +20 mV for CaV1.2 (XhoI) wt; E461A, E462R, K465N, L468R, D469A, T472D, and Q473K (from left to right). The r300 ratios varied from 0.73 ± 0.01 at 0 mV to 0.67 ± 0.02 at +20 mV (23) for CaV1.2 (XhoI) wt; 0.53 ± 0.02 at 0 mV to 0.44 ± 0.03 at +20 mV (11) for E461A; 0.38 ± 0.02 at 0 mV to 0.29 ± 0.01 at +20 mV (20) for E462R; 0.87 ± 0.02 at 0 mV to 0.82 ± 0.01 at +20 mV (10) for K465N; 0.82 ± 0.01 at 0 mV to 0.76 ± 0.02 at +20 mV (7) for L468R; 0.69 ± 0.02 at 0 mV to 0.63 ± 0.03 at +20 mV (11) for D469A; 0.85 ± 0.01 at 0 mV to 0.77 ± 0.01 at +20 mV (16) for T472D; and 0.81 ± 0.01 at 0 mV to 0.71 ± 0.01 at +20 mV (15) for Q473K. As compared with CaV1.2 (XhoI) wt, the r300 were significantly smaller at p < 10−16 for E462R and at p < 10−6 for E461A when measured at 0 mV, whereas they were significantly larger for K465N, L468R, T472D, and Q473K at 0.001 < p < 0.01 under the same conditions. In contrast, r300 were not significantly different between CaV1.2 (XhoI) wt and D469A. (D) Voltage dependence of inactivation was estimated from isochronal inactivation data points measured after 5 s conditioning pulses applied between −100 and +30 mV from a holding potential of −100 mV. The fraction of the noninactivating current was recorded at the end of the pulse and data were fitted to Boltzmann Eq. 1. The voltage dependence of inactivation was similar for all constructs. The final fraction of noninactivating Ba2+ current decreased from 0.46 ± 0.03 (9) for T472D and 0.46 ± 0.05 (10) for K465N; to 0.38 ± 0.04 (7) for L468R and 0.30 ± 0.03 (15) for Q473K; to 0.20 ± 0.02 (19) for CaV1.2 (XhoI) wt; to 0.14 ± 0.04 (10) for E461A, 0.13 ± 0.02 (5) for D469A; and 0.09 ± 0.01 (19) for E462R at + 10 mV. Complete set of fit values are shown in Table 1.

