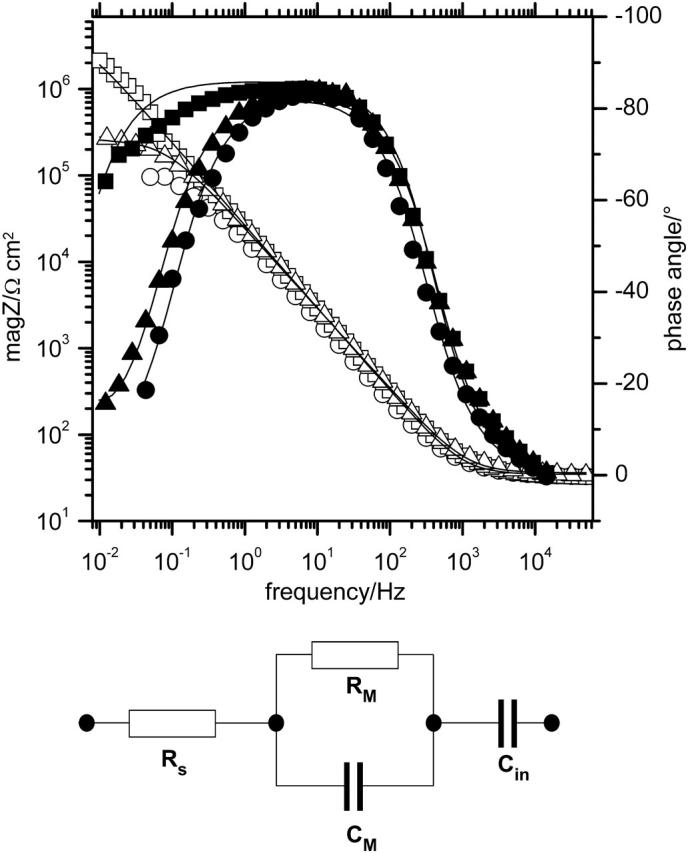
FIGURE 6.

Impedance spectra measured at different stages of the experiment. Adsorbed CcO (Δ, ▴); after dialysis for 12 h (□, ▪); after activation with cyt c (○, •). Equivalent circuit used to fit the electrochemical data are: Rs solution resistance; Rm resistance of the lipid membrane; and Cm capacitance of the lipid membrane.
