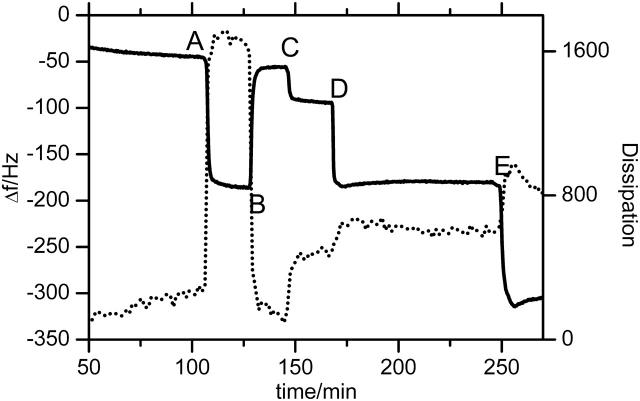
FIGURE 7.
Frequency shift (solid line) and dissipation (dotted line) at different stages of the binding experiment, measured by QCM. The DTSP-NTA SAM was prepared ex situ. At point A the cell was flushed with 40 mM CuSO4 buffer that is changed to pure water at point B. Points C and D indicate perfusion with PBS and PBS/DDM, respectively. CcO was added at point E.

