
FIGURE 6.
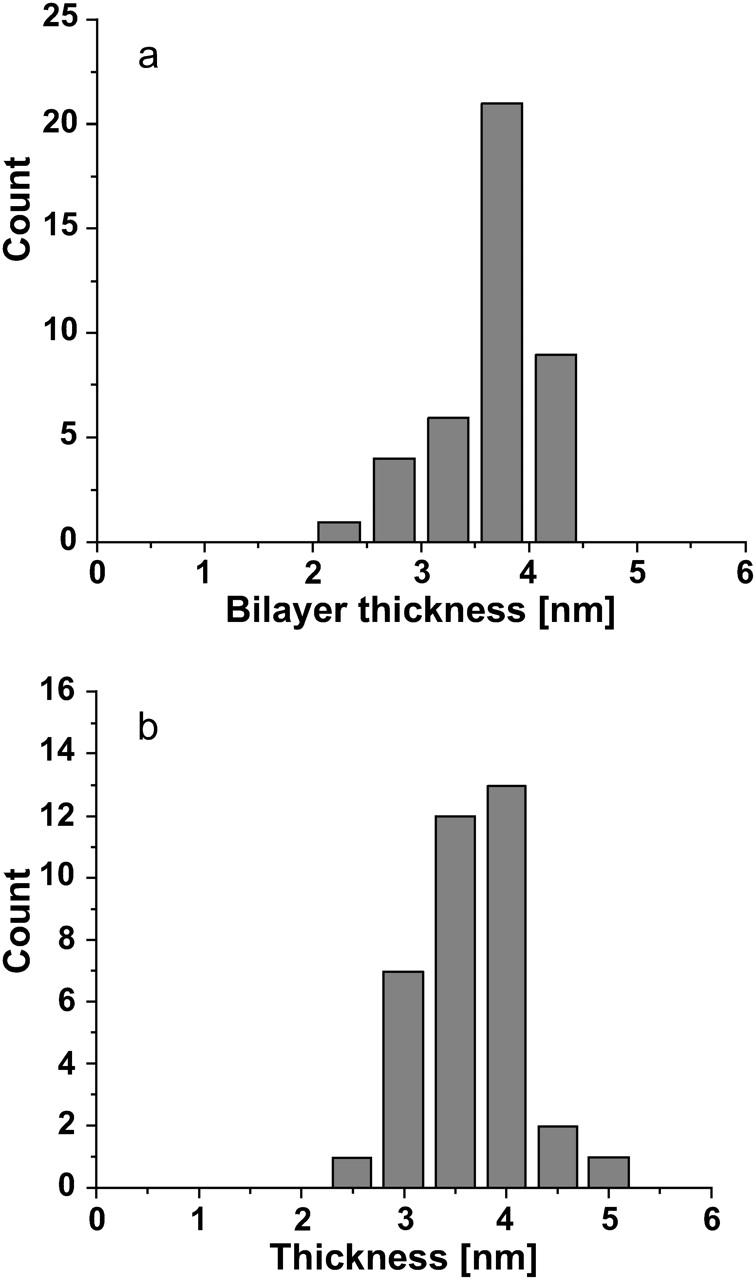
DOPG bilayer thickness (a) before and (b) after the introduction of 5 μg/mL cytochrome c. Differences in the mean are within instrumental noise although higher statistical moments seem to differ significantly possibly indicating a more fluid environment.