
FIGURE 7.
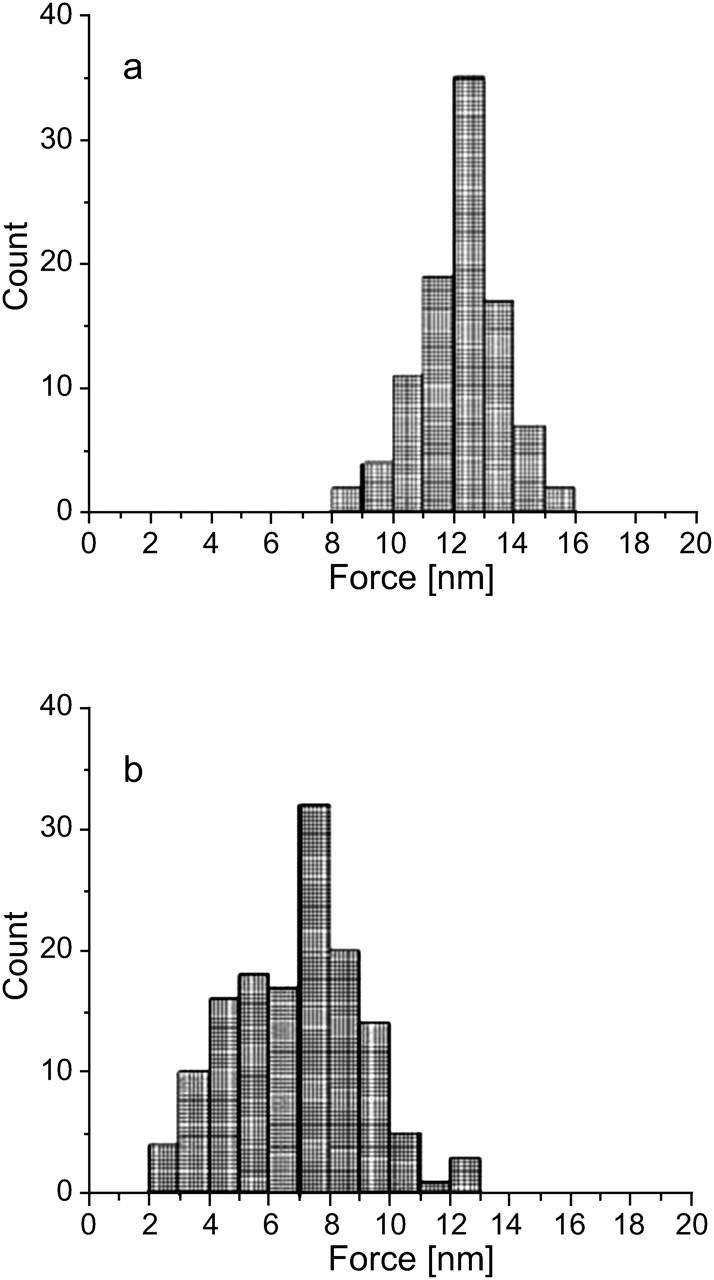
DOPG bilayer punchthrough force histograms (a) before and (b) after the introduction of 5 μg/mL cytochrome c. The mean force is reduced by ∼45% and, again, higher statistical moments are consistent with a more fluid environment.
Official websites use .gov
A
.gov website belongs to an official
government organization in the United States.
Secure .gov websites use HTTPS
A lock (
) or https:// means you've safely
connected to the .gov website. Share sensitive
information only on official, secure websites.
DOPG bilayer punchthrough force histograms (a) before and (b) after the introduction of 5 μg/mL cytochrome c. The mean force is reduced by ∼45% and, again, higher statistical moments are consistent with a more fluid environment.