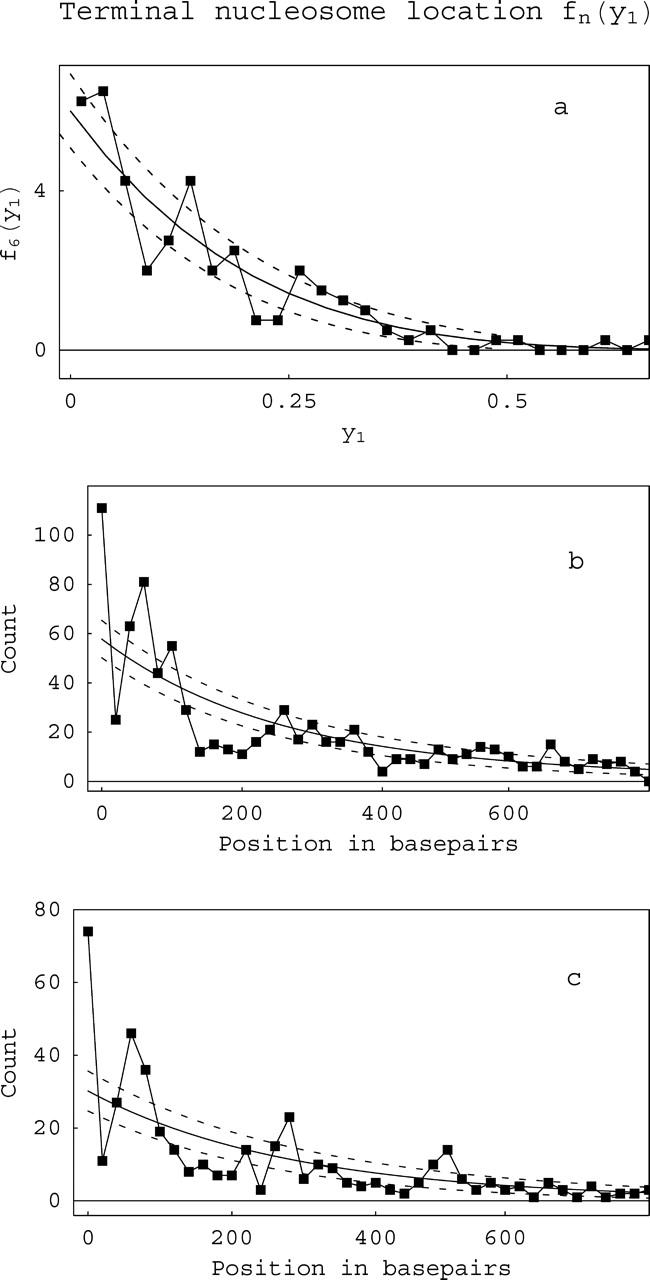
FIGURE 8.

Location distributions for the most terminal nucleosome. hn(y) is the probability for finding the first nucleosomes, i.e., the two most terminal ones, at any position y on a DNA template containing n nucleosomes. (a) Distribution for h6, i.e., arrays containing only six nucleosomes. (b and c) Composite h(y) distributions (the weighted sum of data from all values n of nucleosome occupation) for 208-12 unacetylated (b) or acetylated (c) arrays. Because we cannot distinguish between the two ends, the distributions are symmetrized; thus only half needs to be shown. The solid lines are the theoretical predictions; the dotted lines are ±1σ from the theoretical value, adjusted for the number of molecules counted, the binning size, etc. The peaks (>+1σ) or valleys (<−1σ) reflect preferred or disfavored positions for the terminal nucleosome. Note the differing x-axis scales for a versus b and c.
