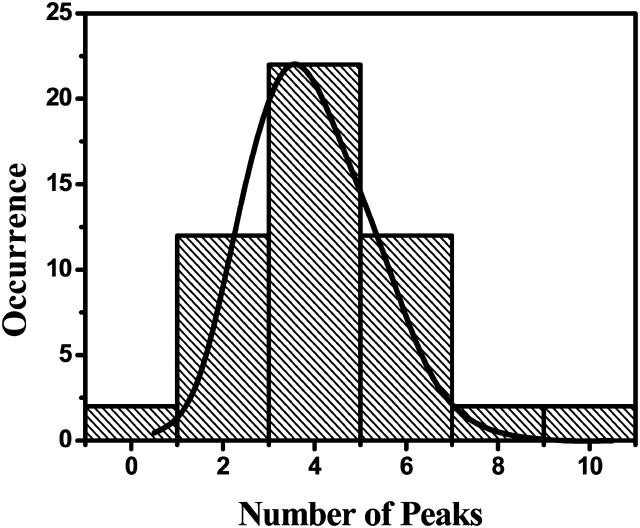
FIGURE 4.
Distribution of the number of detected bands in a single-molecule spectrum. The bars are the experimental data; the solid line represents a simulation of 1000 individual complexes. The maximum of the simulated distribution has been normalized to the maximum of the experimental distribution.

