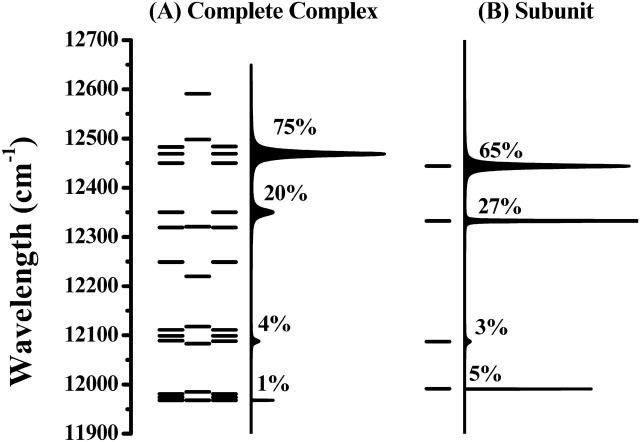
FIGURE 5.
Graph of the exciton manifold of LH4 without diagonal disorder. The percentual contribution to the total transition dipole strength is noted for the dominant transitions. (A) The energies of the exciton states of the complete complex. Due to the symmetry of the complex, a large part of the exciton states is degenerate. The right part shows the optical spectrum. (B) The energies of the exciton states of a single subunit. The right part shows the optical spectrum.

