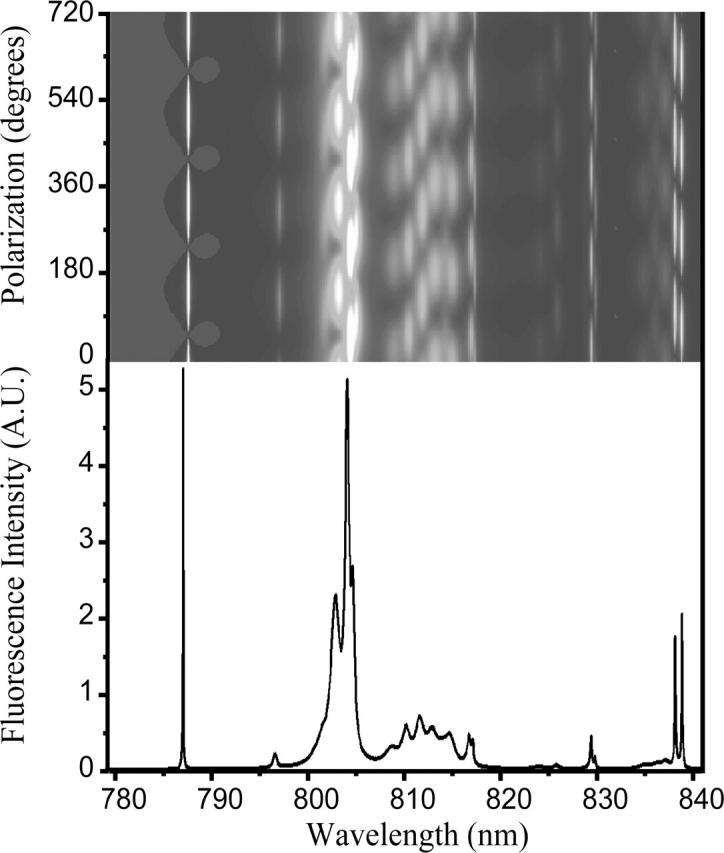
FIGURE 6.

Simulated polarization-dependent single-molecule spectrum of LH4. This graph was selected from a series of 40 randomly generated spectra (see text for details) for having the most features in common with the experimental spectrum in Fig. 2 A. The narrow lines at the edges of the spectrum are difficult to observe experimentally because they contain only 1–2% of the total oscillator strength. Furthermore, the simulated spectrum has not been corrected for instrument response or spectral diffusion.
