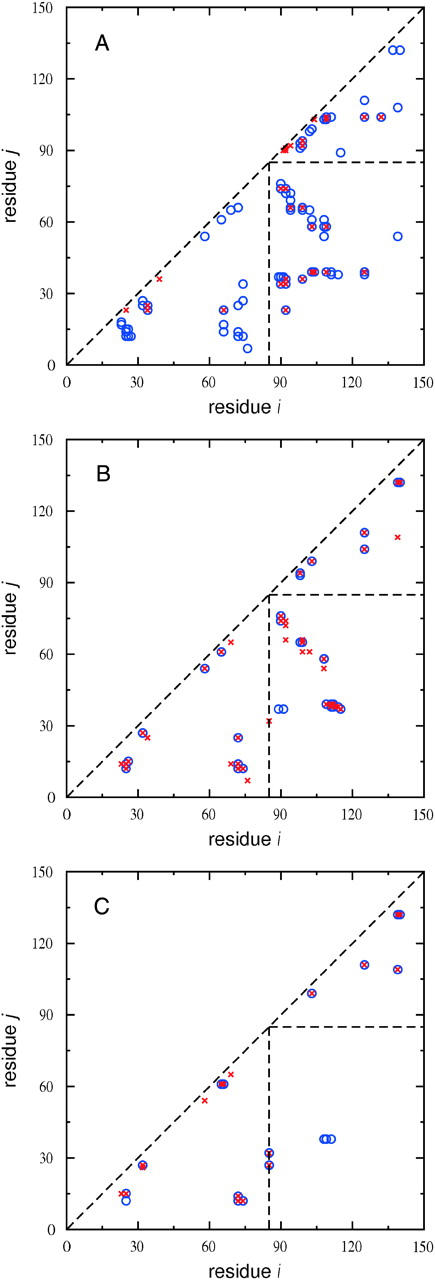
FIGURE 12.

Hydrophobic contact maps of SN calculated from MD simulations of the native state (A) and at 1 bar (B) and 8 kilobars (C) after water insertions as described in the text. The point (i,j) represents a contact between hydrophobic residues i and j if the distance between their β-carbon atoms is <7 Å. This distance is calculated from the α-carbon atom for glycine. All contacts have an occurrence probability >0.5 in the sampled interval of the MD simulation. Contacts are not represented for |i−j| ≤ 3 in A–C. (A) Unfilled circles represent all hydrophobic contacts, and crosses represent those probed by water insertions. (B, C) Unfilled circles represent hydrophobic contacts found in the first 50 ps of MD simulation and crosses represent hydrophobic contacts found in a 50-ps interval at 1 ns (B) and 2 ns (C) of MD simulation. The dashed lines divide contacts into three regions: the two triangles define contacts within the two subdomains of SN, and the lower right-hand rectangle defines contacts between the two subdomains.
