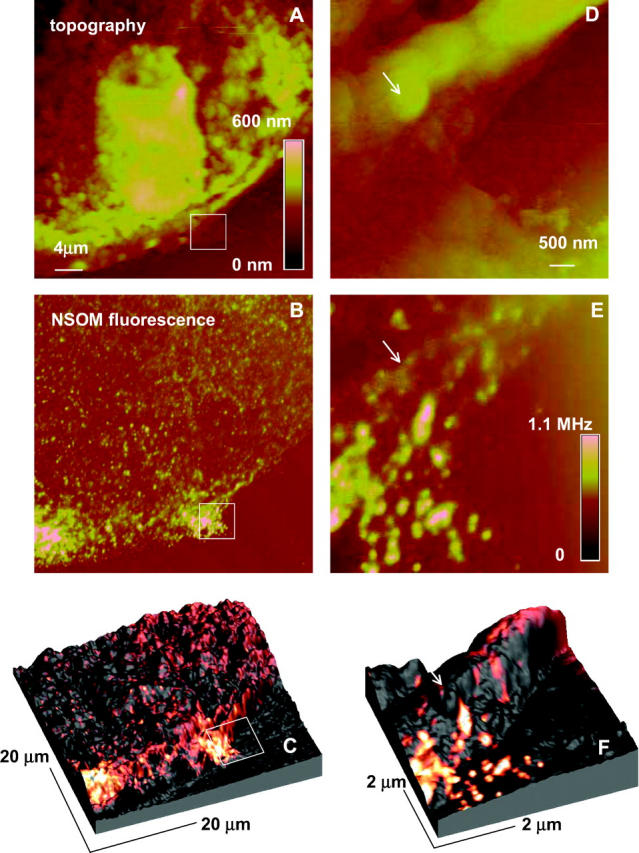
FIGURE 2.

Topography (A and D), NSOM (B and E), and composite 3-D (C and F) images of H9C2 cells stained for the L-type Ca2+ channel, excitation wavelength 568.5 nm, probe aperture size ∼60 nm. The 5 × 5 μm2 images (D and E) were obtained by zooming the indicated area of the cell. The 3-D images display a combination of the topographic data (height) and fluorescence data (color-coded).
