
FIGURE 8.
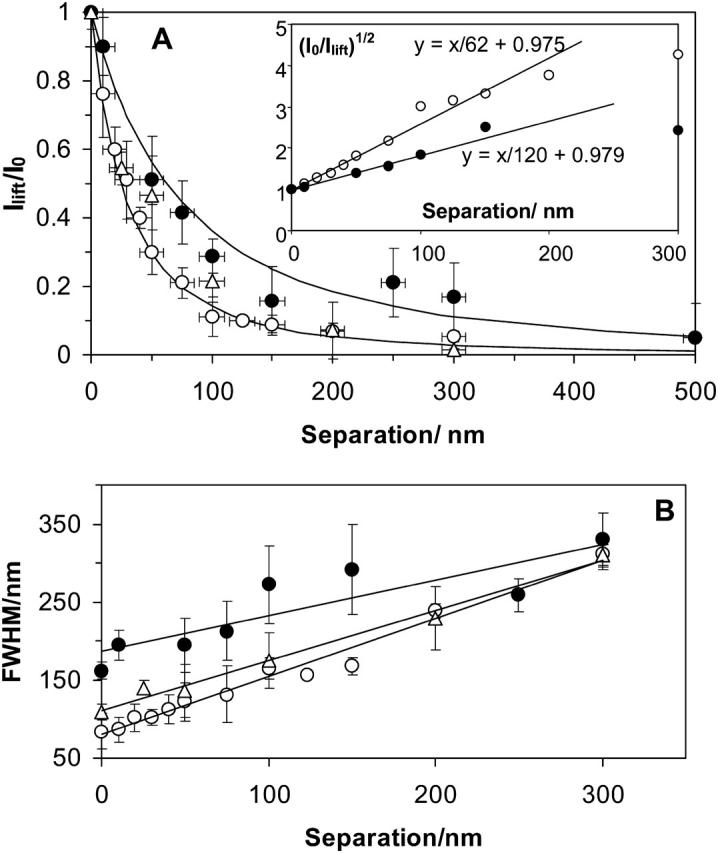
(A) Dependence of the LiftMode relative intensity of the maximum fluorescence signal across a sphere (Ilift/I0, averaged over many spheres) on the tip-to-sample separation for 60- (○) and 150-nm (•) probes. The solid lines show the decay predicted by a (d/(d + h))2 function, where d is the NSOM probe aperture diameter and h is the tip-to-sample separation. Inset: the dependence of (I0/Ilift)1/2 on separation for ∼60 nm and ∼150 nm probe apertures. (B) Dependence of the measured sphere size (FWHM) on the separation between the tip and the sample for aperture diameters of 60 nm (○ and ▵) and 150 nm (•). 100× NA = 1.3 (○) and 40× NA = 0.65 (• and ▵) objectives were used.