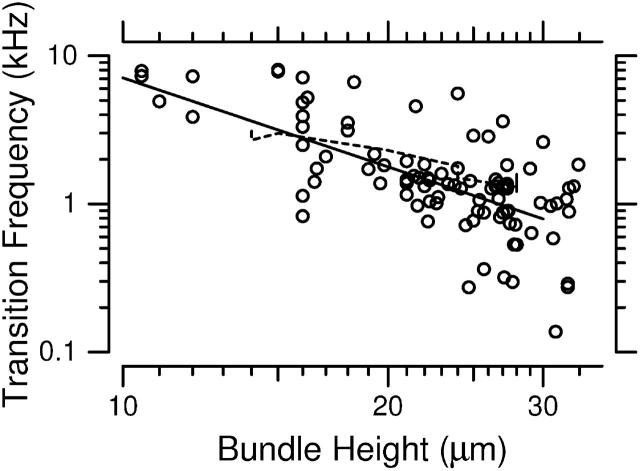
FIGURE 10.
The frequency at which the phase of HDefl(f) was +60°, plotted versus bundle height. These measurements are based on three-dimensional analyses of motion of hair bundles in four preparations. The solid line is repeated from Fig. 9 A. Note that the scale of this plot differs from that of Fig. 9.

