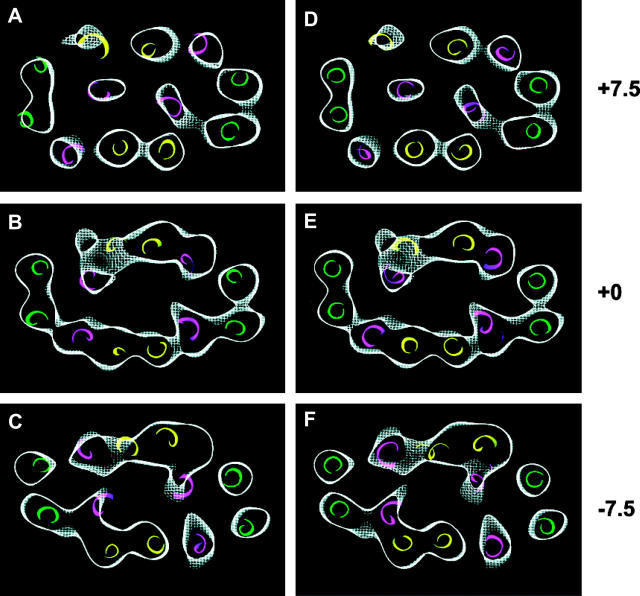
FIGURE 4.
Selected horizontal sections from the 6.5-Å density map of OxlT in the oxalate-bound, “closed” state near the periplasmic end (A, D), center of membrane (B, E), and cytoplasmic end (C, F). The sections are 3-Å thick and are at intervals of 7.5 Å from the center. Helices are colored using the same color scheme used in Fig. 1 A. (A–C) Helix positions derived from the rigid-body refinement procedure described in the text starting from knowledge of the x-ray coordinates of GlpT. (D–F) Helix positions derived from a manual fit of helices into the density map as previously reported (Hirai et al., 2002).

