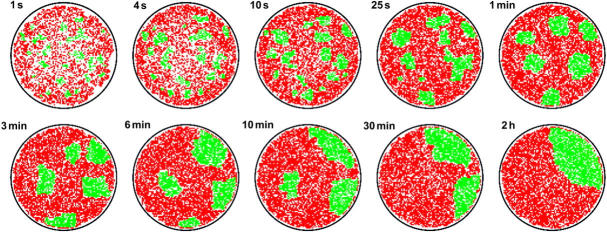
FIGURE 4.
Typical pattern evolution without active TCR transport for the effective binding energies UTM = 5.5 kBT of TCR/MHCp complexes, ULI = 4 kBT of LFA-1/ICAM-1 complexes, and the same molecular concentrations as in Fig. 3. Membrane patches with bound TCR/MHCp complexes are shown in green, patches with bound LFA-1/ICAM-1 complexes in red.

