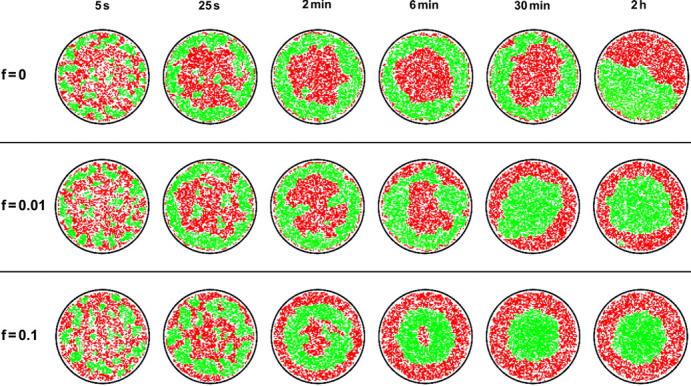
FIGURE 7.

Pattern evolution with active transport of TCRs toward the center of the contact zone. Membrane patches with bound TCR/MHCp complexes are shown in green, patches with LFA-1/ICAM-1 complexes in red. Molecular concentrations and binding energies are the same as in Fig. 3 (ring regime). (Top) At zero force, the intermediate TCR/MHCp pattern is stable for 30 min and more. In the final equilibrium pattern, both types of domains are in contact with the rim of the adhesion region (see Adhesion Dynamics in the Absence of Cytoskeletal Transport Processes). (Middle) At the force F = 0.01 kBT/a, the final equilibrium state is the target-shaped mature synapse of T cells. This state is already established within 30 min. (Bottom) At the 10-fold stronger force F = 0.1 kBT/a, the final target-shaped pattern already forms within 5–10 min. An intermediate pattern with a TCR/MHCp ring appears ∼30 s after initial contact.
