
FIGURE 6.
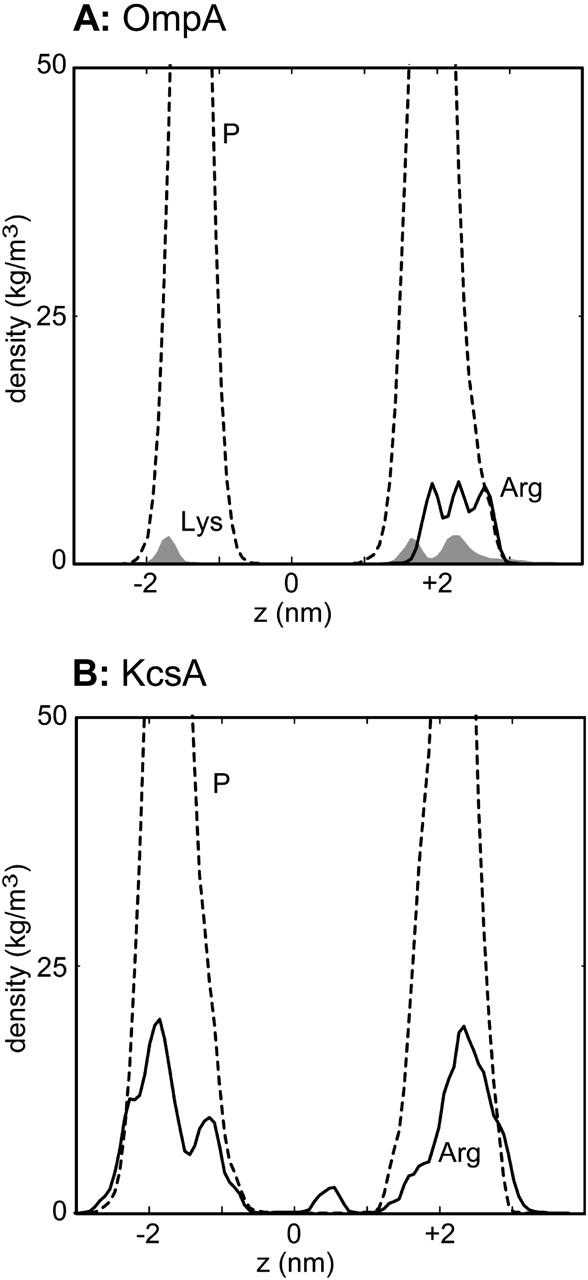
Simulation-averaged atomic densities versus bilayer normal axis for (A) OmpA and (B) KcsA. In A, densities are shown for the Lys side-chain amine group (shaded, solid), for the guanidinium group of Arg (black solid line), and for lipid headgroup phosphorus atoms (black broken line). In B, densities are shown for the Arg guanidinium (black solid line) and for lipid headgroup phosphorus atoms (black broken line).