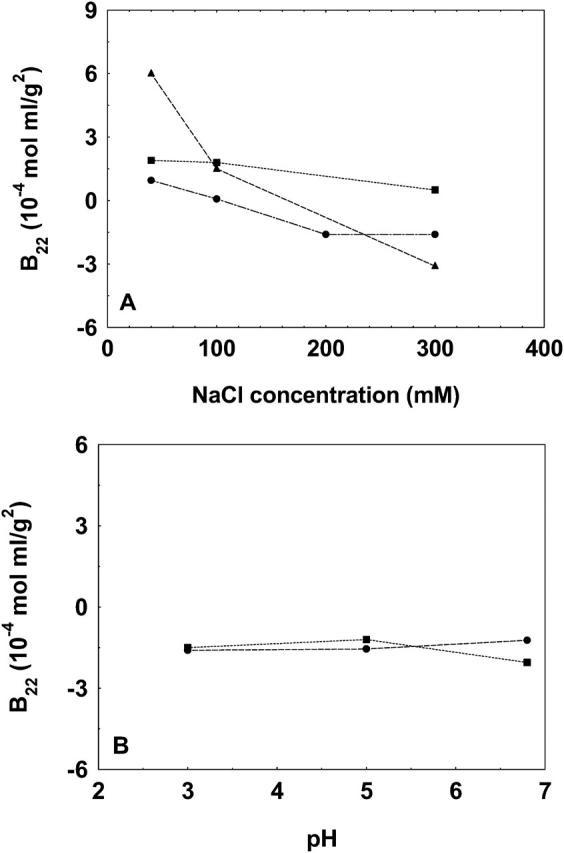
FIGURE 6.

The B22 values of chymotrypsinogen at pH 3.0 at varying NaCl concentrations (A) and at NaCl concentration of 300 mM at varying pH (B) determined by the method presented in this study (•), compared to those reported in literature obtained either by batch-mode static light scattering method (Velev et al., 1998) (▴) or by self-interaction chromatography (Tessier et al., 2002) (▪). The lines are used as a guide to the eye.
