
FIGURE 2.
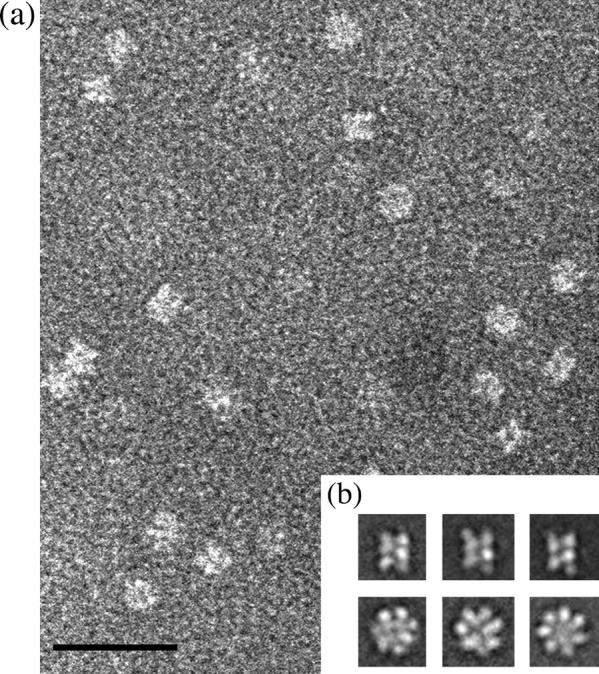
Electron micrograph and class averages of 16S particles. (a) Raw images of 16S proteasome precursor complex in negative stain. The scale bar represents 30 nm. (b) The class averages revealed two common views of the structure: three side-view averages with two parallel bars implying the presence of two rings (top panel) and three ring-like end-view averages (bottom panel) with a strong indication of sevenfold symmetry. The scale bar represents 30 nm.