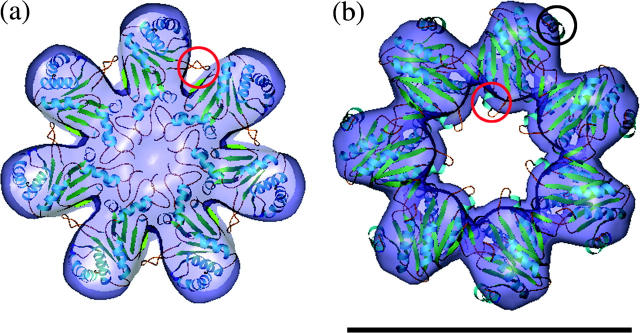
FIGURE 4.
The ribbon schematics of the α- and β-rings in the orientation of the crystal structure of 20S placed into the EM map of 16S. (a) A view from the α-ring end shows the protruding loop (residues 45–55), which is circled in red. (b) A view from the β-ring end shows the protruding regions Helix 2 and following loop (residues 84–96), and Helix 5 (residues 188–202), which are circled in red and black, respectively. The scale bar represents 10 nm.

