FIGURE 5.
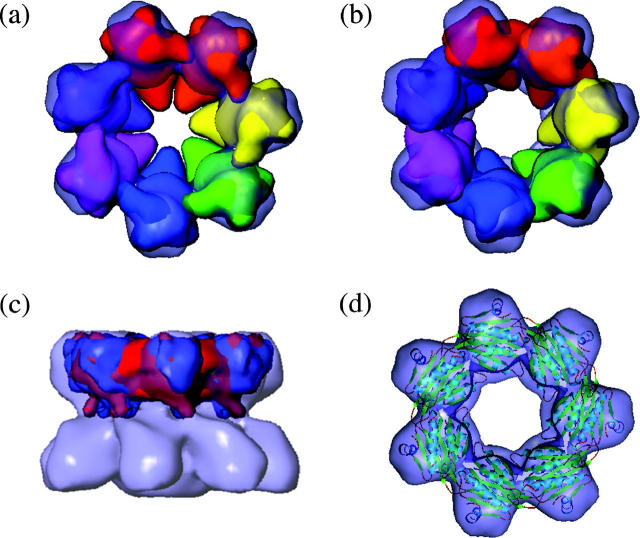
Comparison between the β-subunits in the EM map of 16S and in the crystal structure of the 20S proteasome. Fit of the β-subunits into the EM map showing the increased pore size in the EM structure. (a) A top view of the β-ring showing the fit of the β-subunits in the crystal structure orientation. All subunits are identical but each is shaded a different color. (b) A top view of the β-ring showing the fit of the β-subunits in the EM structure orientation. All subunits are identical but each is shaded a different color. (c) Helix 1 of the β-subunits makes contact with the α-subunits. β-Subunits in the crystal orientation shown in red and β-subunits in the EM orientation shown in blue. (d) Ribbon diagram of the β-ring in the orientation corresponding to the position of the EM map fitted into the β-ring map.

