
FIGURE 1.
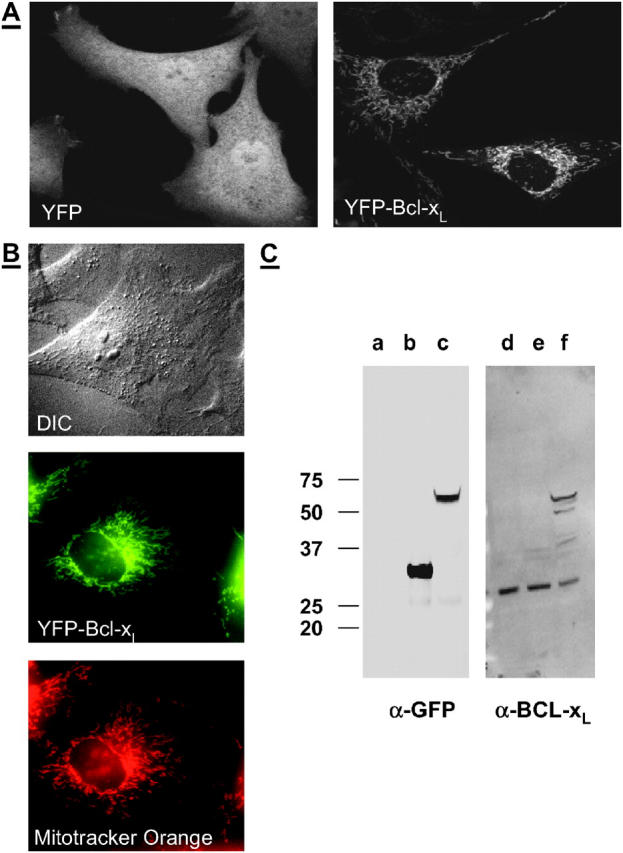
YFP and YFP-BCL-xL expression in CSM 14.1 cell lines. (A) Distribution of YFP fluorescence in cell lines transfected with YFP (left) and YFP-BCL-xL (right). (B) Differential interference contrast (DIC; top) and fluorescent images of a cell transfected with YFP-BCL-xL. The distribution of YFP-BCL-xL (middle) coincides with the distribution of Mitotracker Orange (bottom), and is restricted to the mitochondria. (C) Expression of YFP and YFP-BCL-xL is confirmed by Western blots. Equal amount of lysates of nontransfected cells (lanes a and d), cells stably expressing YFP (lanes b and e), or YFP-BCL-xL (lanes c and f) were immunoblotted for YFP (left) or BCL-xL (right).