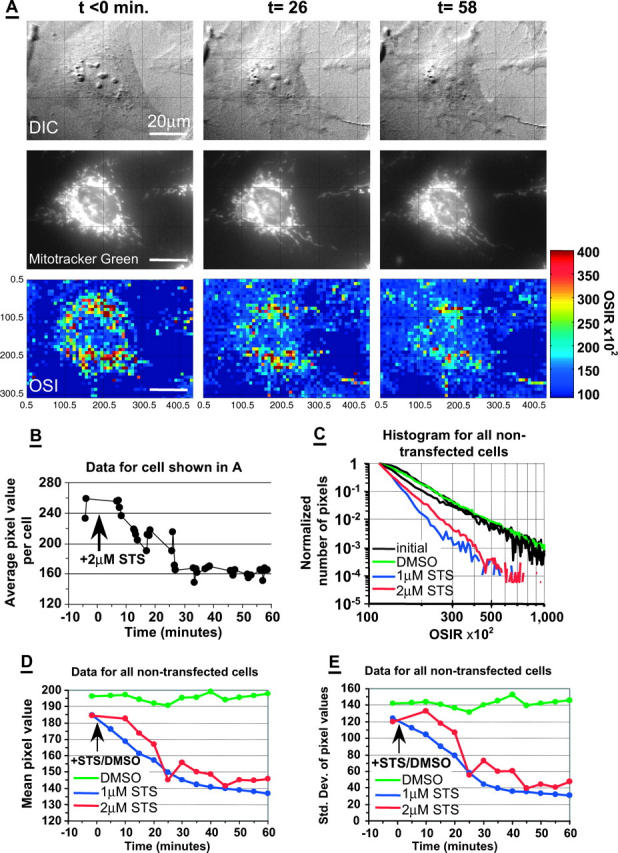
FIGURE 3.

Light scattering response to STS. (A) Sequential images of a nontransfected, Mitotracker-labeled, CSM 14.1 cell before and after treatment with 2 μM STS at t = 0. Top panels, DIC; middle panels, Mitotracker Green fluorescence; bottom panels, optical scatter images (OSI) with pixel intensity equal to OSIRx102 (OSIR defined in Eq. 1). (B) Average OSIR measured in the cell shown in panel A and plotted as a function of time. (C) Normalized histogram of pixel values collected in all image segments of nontransfected cells before treatment (initial; black solid lines), and after treatment with DMSO (green solid line, 75 cells), 1 μM STS (blue solid line, 29 cells) or 2 μM STS (red solid line, 30 cells). Each of the initial black solid lines corresponds to each of the three groups of cells later treated with DMSO, 1 μM STS, or 2 μM STS. (D) Histogram means calculated before normalization of histogram, and plotted as a function of time. (E) Histogram standard deviations calculated before histogram normalization, and plotted as a function of time. In panels D and E, the data were averaged over 5-min time intervals.
