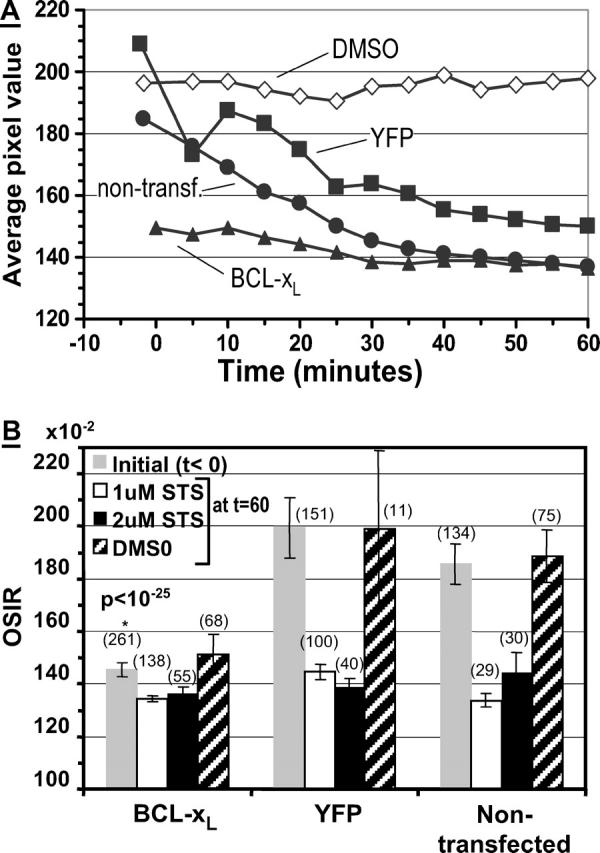
FIGURE 7.

(A) Comparison of OSI pixel histogram mean for nontransfected cells (solid circles), YFP cells (solid squares), and BCL-xL cells (solid triangles) treated with 1 μM STS at t = 0. Open diamonds, nontransfected cells treated with DMSO. Data averaged over 5-min time intervals. Pixel value = OSIR × 102. (B) Average OSIR calculated on a single-cell basis before STS treatment (shaded bar), and 60 min after treatment with DMSO (cross-hatched bar), 1 μM STS (open bar), or 2 μM STS (solid bar). P < 10−25 on the BCL-xL shaded bar indicates a very low correlation probability between the initial populations of YFP and YFP-BCL-xL transfected cells (Student's t-test). Error bars represent the 95% confidence interval of the mean. The number of cells tested in each case is in parentheses.
