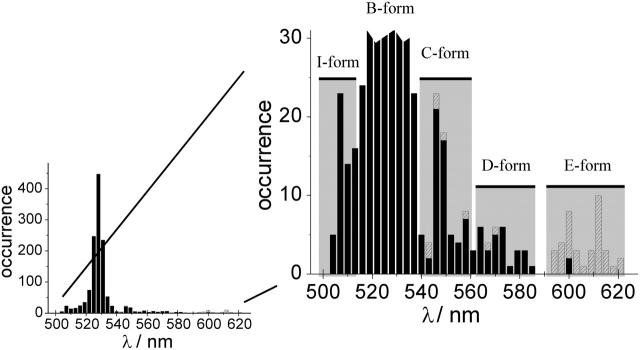
FIGURE 1.
Histogram of the maximum positions of single EYFP protein emission spectra. Black columns, λex = 488 nm; shaded columns, λex = 514 nm and spectra with maximum red shift beyond 540 nm. Left, most spectra have their emission maximum distributed around 528 nm, which is in good accordance with the bulk spectrum. Right, zoomed section of the histogram. Emission maxima outside of the B-form position distribution are clearly visible. The spectral positions of the different forms are indicated by shaded columns in the background. On the blue-shifted side a population of proteins emitting in the I-form with emission maximum below 510 nm can be seen, whereas on the red-shifted side above 540 nm, contributions from the emission of three more, so far unknown forms, are visible.

